
Pico Drive
Car Data & Trips
Your car’s diagnostics in real time, and every trip brought into analysis. A sneak peek at what is on the workbench.
⚙ On the workbench
Pico Drive
Reads your car’s diagnostics in real time and shows live readings on a screen, or logs quietly as a black box; every trip is brought into analysis.
A sneak peek: the live screen on the left, and in the next tabs a few highlights from the analysis of one real trip.
- Used in Vehicles & Fleets
Example trip · 20.8 min · 14.1 km
Route map
Every second of the trip on the map: the route colored by speed, and each event the analysis found, from warm-up to fuel trims and ignition timing. Tap an event for its readings.
Use the Layers panel to show or hide the speed colors, the speed-limit check, overspeed events and each group of analysis events. Hover or tap a dot for details; Ctrl + scroll (two fingers on a phone) to zoom. The start and the end of the trip are left out on purpose.
Example trip · 20.8 min · 14.1 km
Speed compliance
Speed limits along the route are estimated from map data and compared with the car’s real speed, second by second. For fleets, it shows at a glance where and how often the limits were exceeded.
Example data from one trip.
Example trip · 20.8 min · 14.1 km
Health check
Each trip is compared with the car’s own history (284 earlier trips). Trends are tracked over time, so a slow drift shows up long before it becomes a problem.
OverallWATCH
3 persistent · 1 emerging · 14 stable
4 signals to keep an eye on
Fuel controlWATCH
1 emerging · 4 stable
Lead signal: fuel trim response to EVAP purge
Idle & airflowOK
3 stable · 1 context
Lead signal: idle airflow (MAF)
ThermalOK
3 stable
Normal warm-up and cooling behavior
O₂ & catalystWATCH
3 persistent · 1 stable
Lead signal: O₂ sensor correlation
ElectricalOK
3 stable
Lead signal: engine-on voltage
Example trip · 20.8 min · 14.1 km
Sensor data
Behind every trip: 13 sensors logged side by side (speed, RPM, load, temperatures, airflow, fuel trims, O₂ sensors, timing, voltage, fuel) and a technical overview where each value is placed against the car’s own history.
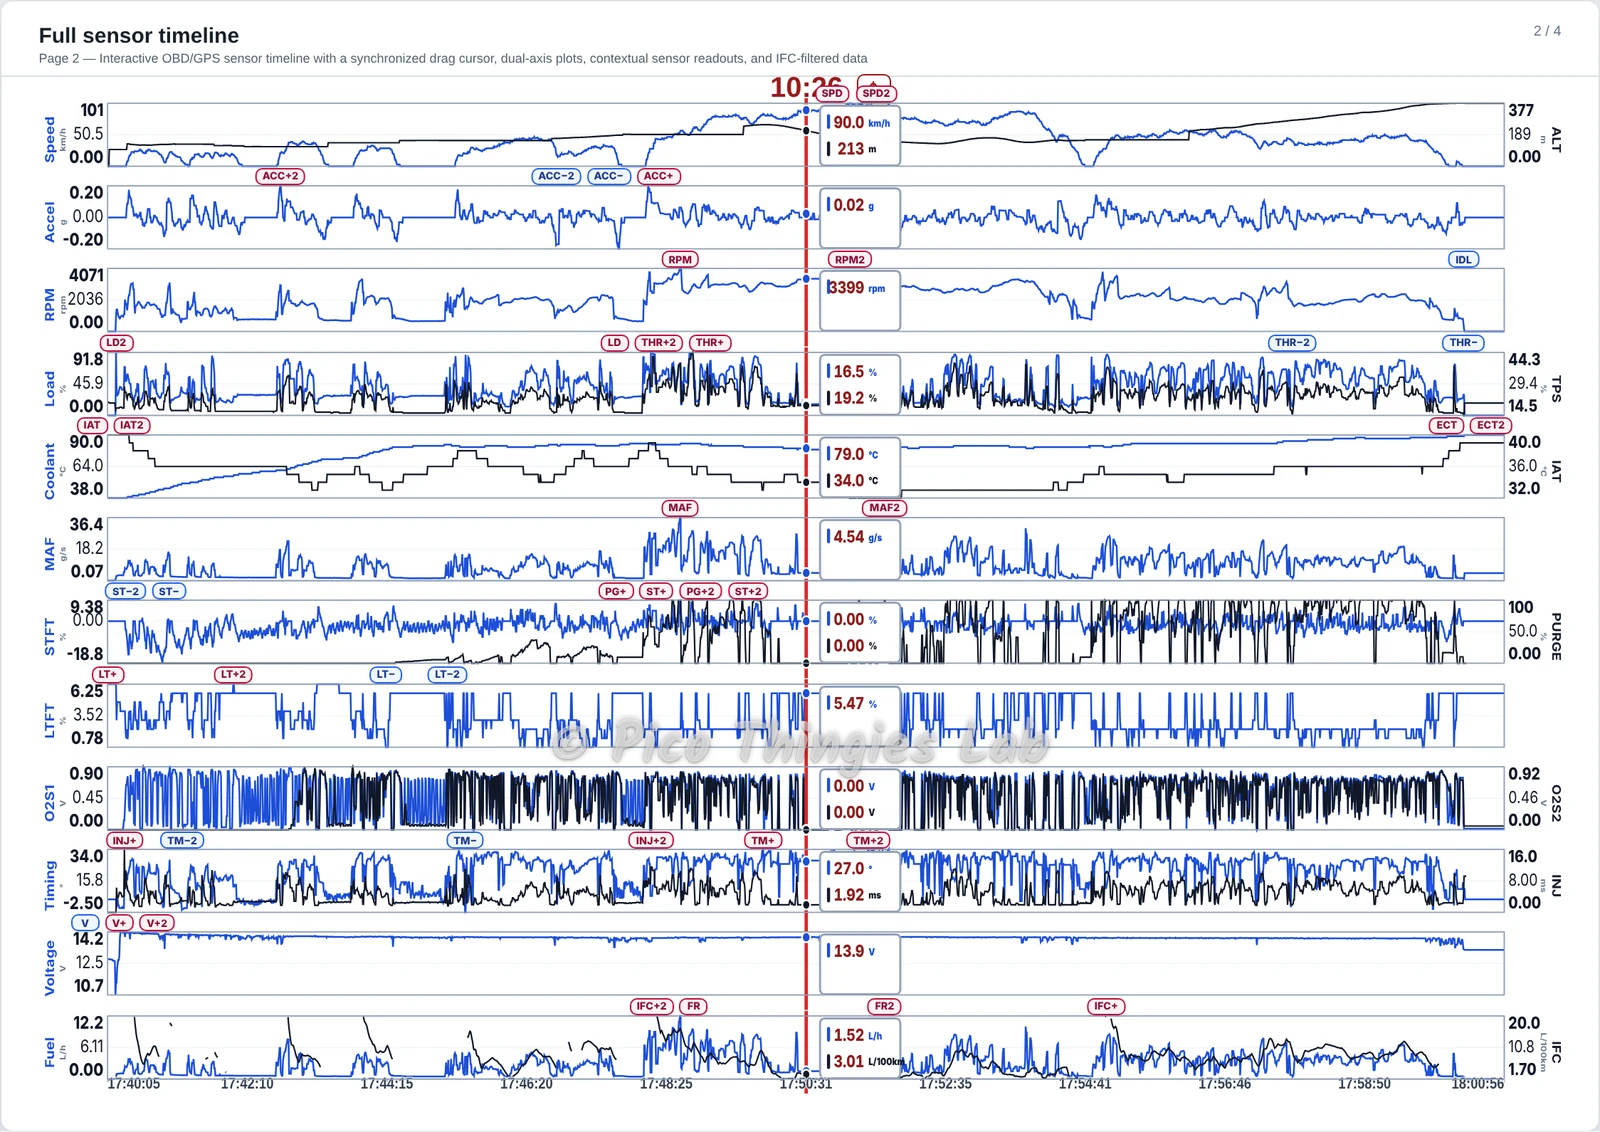
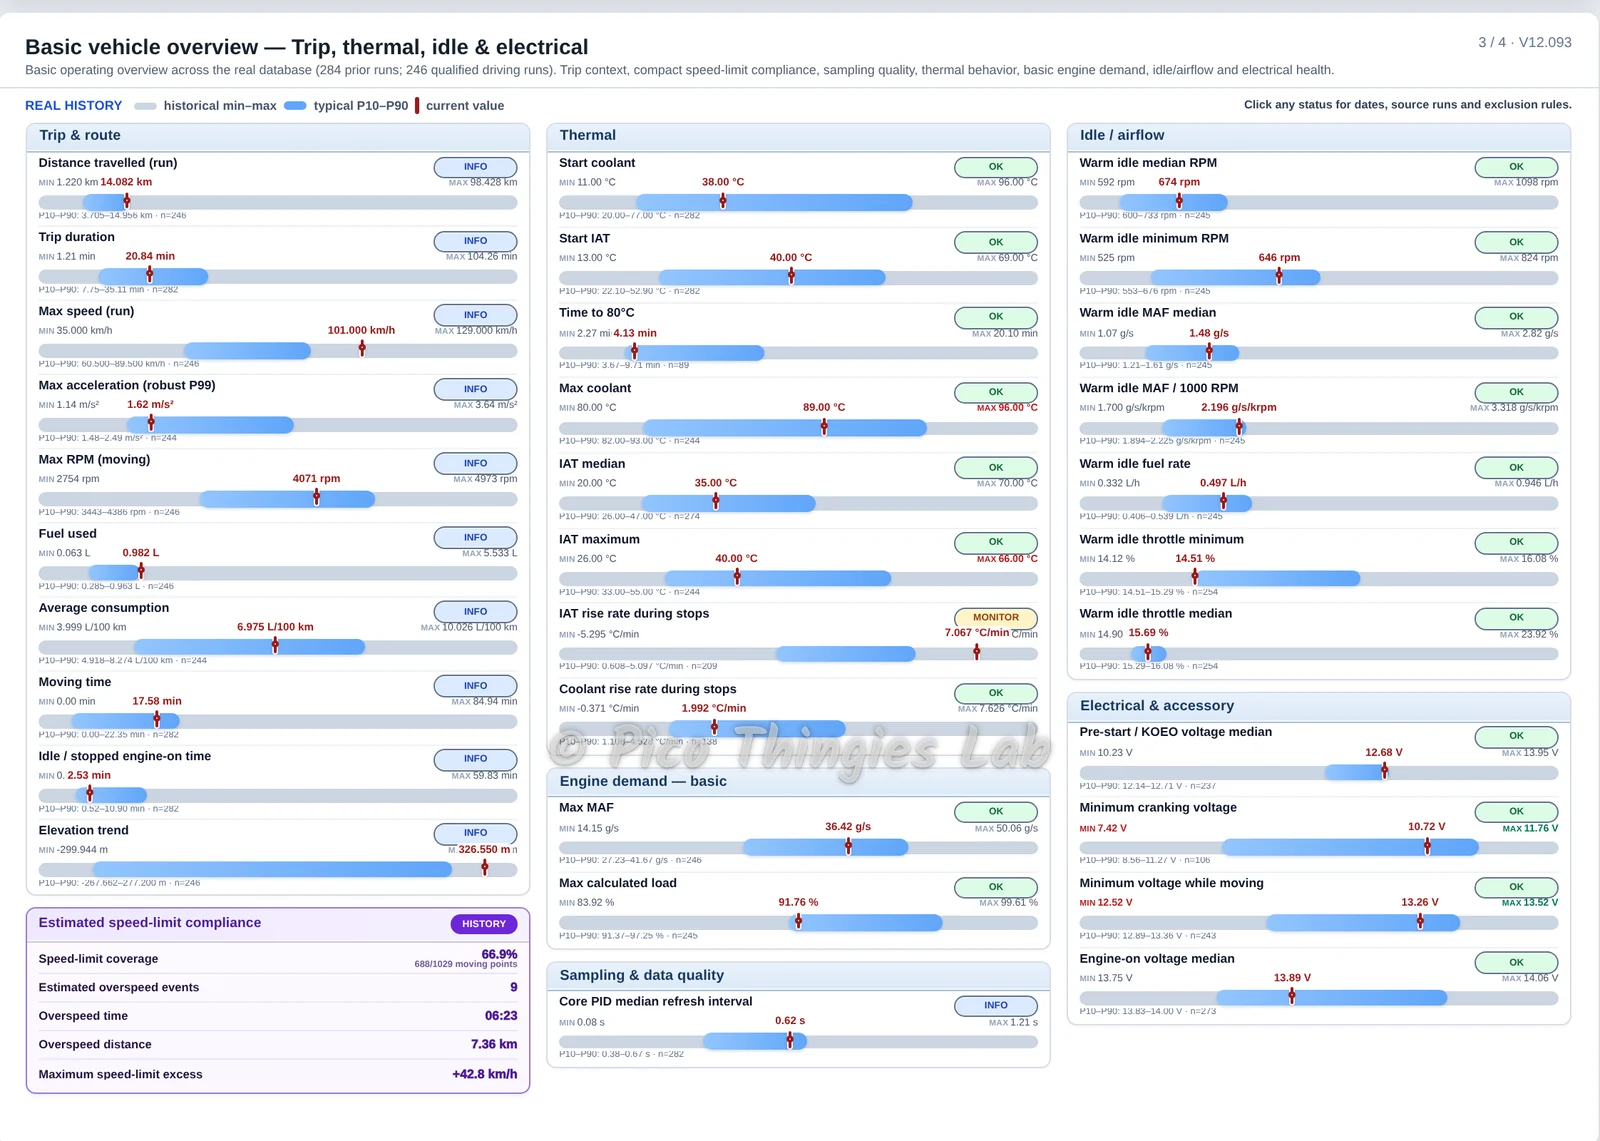
Click to enlarge.